
At the peak of the mining boom in Australia it was vogue to use value driver trees to analyse your mining operations and to answer questions like “should I buy more trucks or am I better off with more excavators?”.
These days there’s less consulting dollars floating around for value driver modelling but that hasn’t stopped it from being a fantastic way to visualise and analyse the flow of value from one part of your organisation to another, regardless of your industry.
This is the first post in a series introducing the concept of value drive modelling and providing some practical examples in how to use it.
What ways can VDM be used?
Throughout this series I’ll show you examples of how VDM can;
- identify where the biggest constraints are in an organisation’s ability to create value.
- be used in conjunction with sensitivity analysis to show which areas are at greatest risk for failing to deliver value.
- value a range of different investment options to find the optimal combination for creating value.
- provide transparency at the individual employee level to see how they contribute to the creation of value.
- allow you to benchmark operations that were previously too different to compare through traditional benchmarking methodologies.
What is value?
Before we get to the diagrams, let’s start with what we mean by ‘value’. Value can be understood as “something of importance, worth, or the usefulness of something”. Value can also be described as profit or stakeholder wealth. So, if organisations create value, when and where does this value come from? To visualise this value creation process we can use Porter’s value chain.

A value chain diagram shows a chain of activities for an organisation operating in a specific industry. The chain of activities gives products or services more value than the sum of the independent activities’ values. The important distinction here is between primary and support activities. The primary activities are where all the value is directly created. The support activities, while critical for sustaining the business, do not add value directly to the product that the customer ultimately buys.
While there are some legitimate criticisms of Porter’s value chain (least of all the failure of his consultancy) it still provides a straight forward framework for understanding how organisation’s might create value.
What are value driver trees?
Value Drive Trees (VDTs) are the main type of diagram used as part of VDM. VDTs are basically a picture of the ‘gears’ or ‘value drivers’ that power a business. Here we have an example of the basic building block of a VDT.

This building block forms part of a much larger VDT, which in this case is for the productivity of a dozer. The individual elements of this building block are simple. It has a heading, units, and a value. The definition of value in this context, is the amount of hectares cleared per annum.

Now if I expand the tree, we see more elements to the VDT. We see that the boxes are connected in a relationship, and that that relationship is described mathematically, in this case, with multiplication signs. It’s apparent that these lower levels elements multiply together to equate to our starting element. This is the fundamental function of a VDT, to transparently show the relationship between different elements of value.
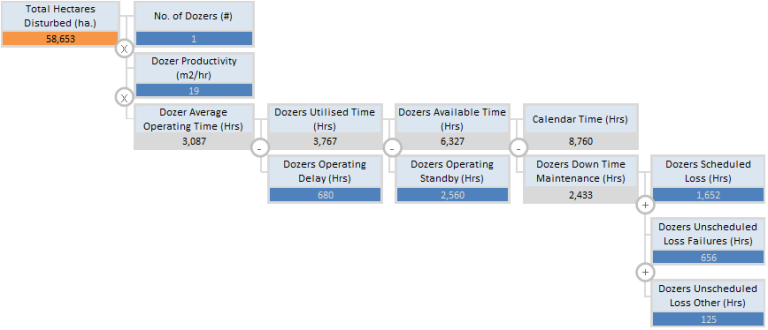
It’s possible for this tree to keep breaking down into ever more detailed steps. What’s important to remember is that we are interested in those elements that are directly contributing value to the final outcome of the VDT.
What are the different types of VDTs?
The rest of this post will go through the different ways VDTs can be used and visualised. To interact with the VDTs, please download the Excel workbook here.
Benefit Realisation VDT
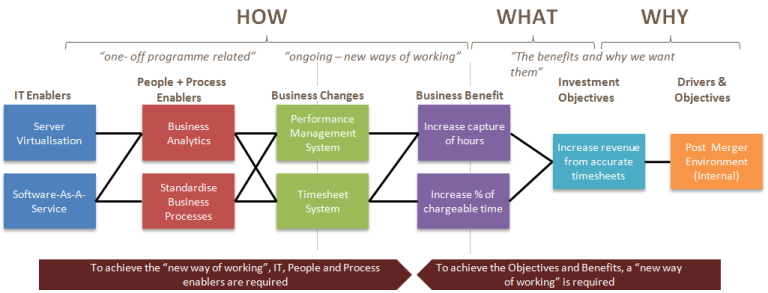
Benefits Realisation VDTs can be built from Benefits Dependency Networks. A Benefits Dependency Network diagram (as above) shows the inter-relationships between enablers, business changes, benefits and investment objectives.
At it most fundamental level, the purpose of a benefit dependency network diagram is to ensure that you don’t double count benefits from interrelated improvements or investments you make to an organisation.

A Benefits Realisation VDT can quantify the benefit as well as show the relationship between the business benefits, operational assumptions and the investment objectives. The matching colours between the above diagrams show where these common elements are.
Revenue VDT
Revenue VDTs show the flow of value through the primary activities of an organisation. This model constrains the flow of value based on key inputs. These constraints can show us where improvements could contribute additional value to the organisation. This is an overly simplistic VDT but shows you the basics of what a revenue VDT can do.

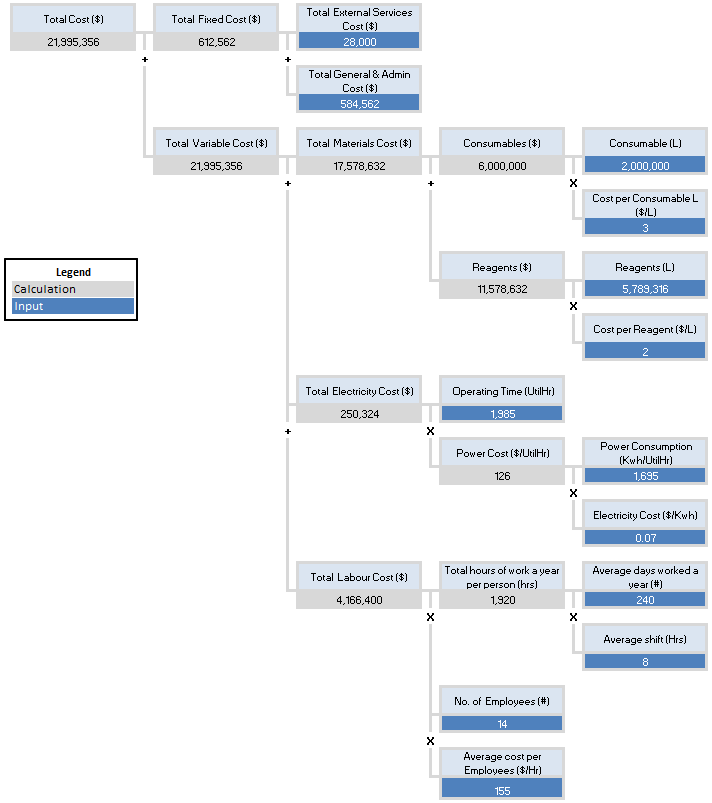
Cost VDT
Similar to a Revenue VDT, a cost VDT can use the same inputs to determine what the cost will be to an organisation. This VDT splits costs between fixed and variable. The variable costs are driven by the same input assumptions as the revenue model.
Profit VDT
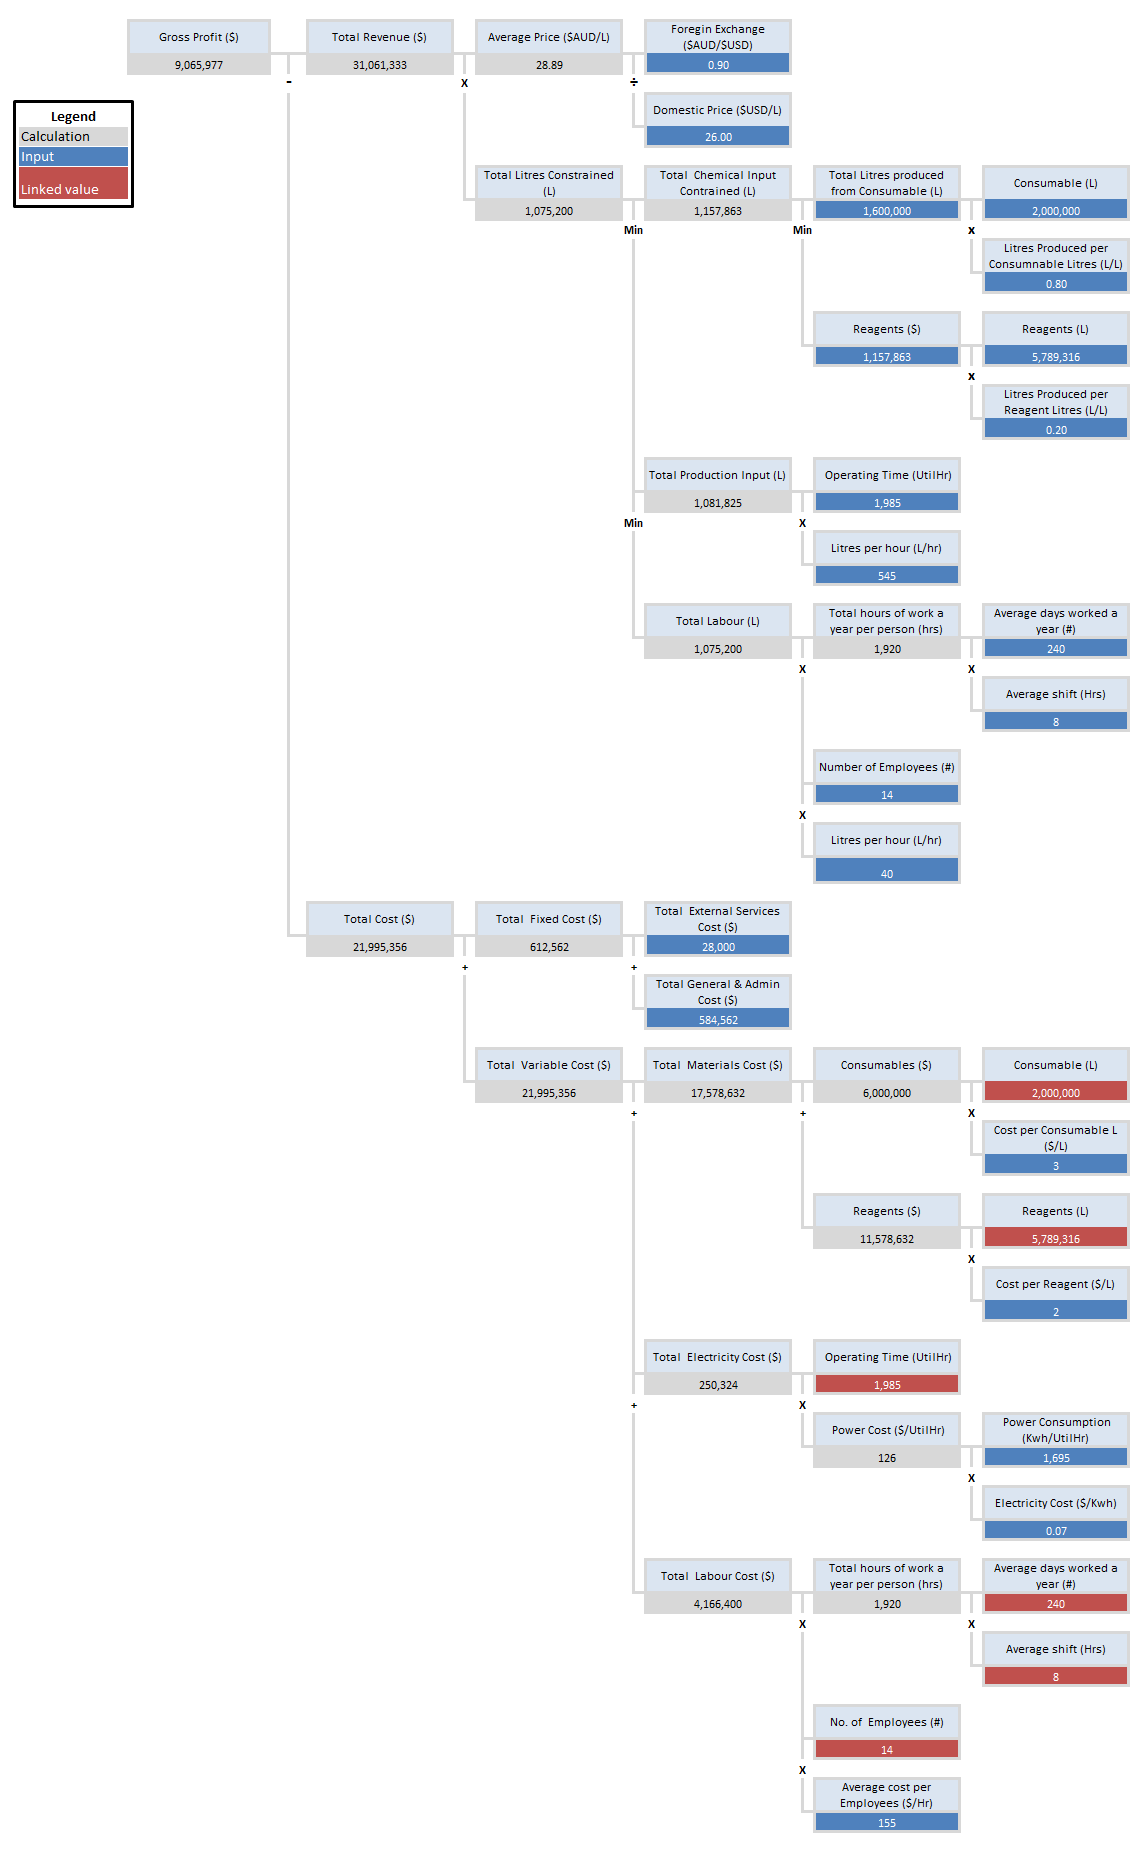
A profit VDT is a simple combination of the Revenue and Cost VDTs. This allows us to change a single input and see how this reflects on the overall value to the organisation. This shows the play off between improving productivity and the impact this also has on cost.
As an experiment, download the workbook and increase the number of employees working in the organisation from 14 to 15 (at cell O37). You might have assumed that having an additional employee might allow the organisation to create more value (in this case, gross profit). However, as you can see, the additional employee also increases the total cost of labour and without a corresponding increase in productivity for the manufacturing plant itself (see Total Production Input (L) at cell L24), the potential value from the new employee is wasted and you’ve reduced the organisation’s profitability by more than $100k.
Financial VDT
A Financial VDT can be used to assess the financial performance of an organisation. For this example, we are measuring the Economic Value Added or EVA of an organisation. EVA is measure of whether a company is earning better than its cost of capital. These financial inputs can be changed to see how the impact on the EVA of the organisation. Here I have also plugged in some standard accounting ratios to show how you can track the financial performance at the same time.

Reporting VDT
The elements of a VDT can contain whatever information you wish them to. For a reporting VDT we can allocate people to be responsible for specific value drivers as well as show how their achievement is dependent on one another. Here we have cascaded KPIs through the organisational hierarchy to specific individuals. We can report on the status on how they are impacting the creation of value.
For example, in the diagram below, you can see that Susan Grace is doing well by keeping the average cost per employee down, but Luke King is affecting value overall because the average shift is greater than 8 hours. Without this level of detail, you might have only known that Margaret Gold’s KPI was on track and not seen the underlying issue of an overworked workforce.

Table VDT
A table VDT contains the same mathematical logic as a VDT however, since it is in a table form, we are able to easily show information over time. In this instance we are using it to measure changes in planned performance. By incorporating time you can analyse seasonable trends or forecast future production.

If this table was to be represented as a diagram, it would look like the VDT below.

Longitudinal VDT
This final example of a VDT shows the flexibility that VDTs have in presenting and calculating value. In this instance, we are showing the change in value drivers over time. For example, we see that variable costs increased around the same time as production costs. We could hypothesis that, when production increases, economies of scale should see a decrease in costs. So we could focus on this area for investigation

The table VDT above, can then be visualised as a diagram as below.

In the next post, I’ll go through some of the fundamental principles you should follow for great VDM design.

Reblogged this on Nicolas Boucher Online Toolbox.
LikeLike
Clear comprehensive examples
LikeLike
In your Financial VDT, shouldn’t the NOPAT be equal to EBIT*(1-Tax) rather than EBIT*Tax?
LikeLike
Correct.
LikeLike
Longitudinal VDT
“We could hypothesis that, when production increases, economies of scale should see a decrease in costs.”
Why a Decrease in costs?
If I am reading the table correctly, the Total Costs increase when the Production increases. So wouldn’t the Hypothesis state there should be an Increase in costs?
LikeLike
Correct. I should have said the ‘cost per unit’ decreases.
LikeLike